Beyond Logs: The Definitive Guide to AI Agent Observability in 2026
In the modern enterprise landscape, AI agents are increasingly moving from experimental sandboxes to the front lines of production environments. An agent handling customer support tickets might close a request with a clean, professional—and entirely incorrect—answer. It may call a "refund-lookup" tool twice with slightly different arguments, choosing to hallucinate based on the second result while ignoring the first. Crucially, the system does not crash. No error flags are raised. The uptime dashboard remains a steady, reassuring green.
The only reason this failure surfaces is a customer’s confused follow-up email two days later. By then, the state of the agent’s internal reasoning process has evaporated, leaving engineers to guess at what occurred. This "silent failure" is the central challenge of the 2026 AI infrastructure era. Unlike traditional microservices that throw standard HTTP 500 errors or clear stack traces, agents operate in a probabilistic gray area. Traditional monitoring tools, built for deterministic software, are functionally blind to the nuances of LLM reasoning.
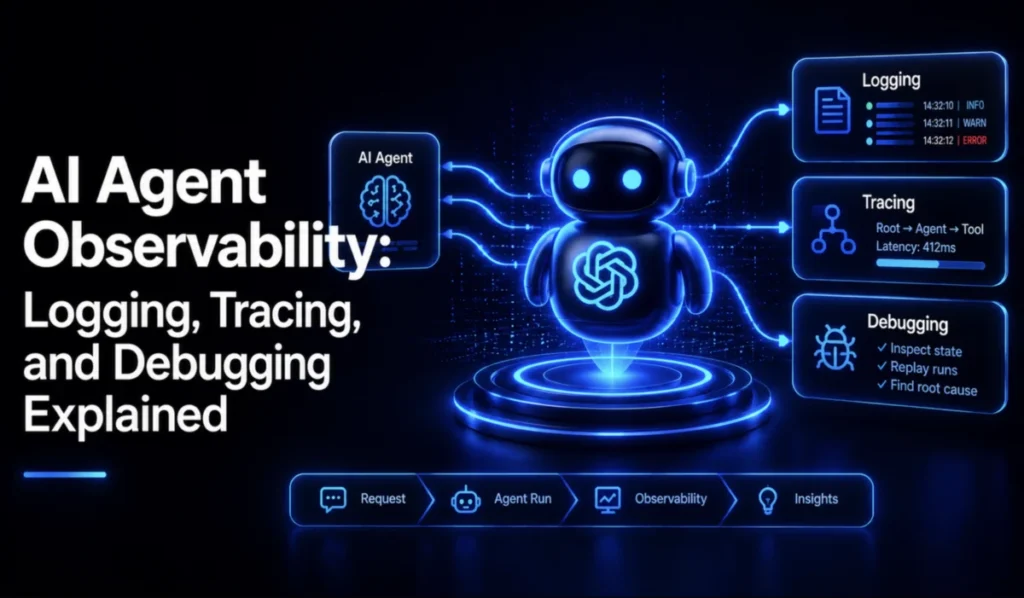
This article explores the technical shift required to achieve true AI agent observability: a discipline that moves beyond simple uptime monitoring to embrace structured logging, distributed tracing, and rigorous debugging workflows.
The Paradigm Shift: Why Traditional Monitoring Fails
To understand why agents break the traditional monitoring model, one must look at the mechanics of failure. In a legacy web application, input leads to a predictable path. In an agentic system, the same prompt can yield drastically different tool-calling sequences due to variations in temperature, retrieved context, or tool availability.
The Breakdown of Metrics
The traditional metrics—CPU usage, I/O latency, and request counts—are insufficient for agents. Instead, developers must pivot to token-centric monitoring. Latency is no longer a function of database query times alone, but of token generation speed, context window size, and the depth of the reasoning chain.
| Signal | Traditional App | AI Agent |
|---|---|---|
| Latency Driver | CPU, I/O, Network | Token Count, Model Size, Context |
| Cost Unit | Requests per second | Tokens consumed |
| Failure Mode | Exception, Timeout | Hallucination, Context Overflow |
| Debug Artifact | Stack Trace | Reasoning Chain, Prompt/Completion |
A single "slow" request in an agentic system might consume ten times the expected token budget, a fact that a requests-per-second metric will completely miss. Furthermore, multi-step chains mean one user request triggers several model calls and tool executions, each serving as an independent point of failure.
The Pillars of Agent Observability
True observability requires capturing every model call, tool execution, and reasoning step as structured data. This allows for the reconstruction of an agent’s "thought process" without needing to replicate the exact conditions of a production run.
1. Structured Logging
The foundation remains logging, but with a critical twist: context. A log statement stating "tool call failed" is useless in a high-concurrency environment. By attaching a trace_id to every log line—a standard practice in OpenTelemetry—developers can filter the logs to isolate the exact execution path of a specific user request.
Logging should focus on the intent and metadata rather than the full output. Storing raw prompt text in logs often creates a privacy liability; logging token counts, tool names, and argument snippets provides sufficient debugging data while maintaining compliance.
2. Distributed Tracing: Stitching the Story
Tracing is the mechanism that provides the "shape" of an agent run. By utilizing the OpenTelemetry GenAI semantic conventions, teams can standardize span names like invoke_agent, chat, and execute_tool.
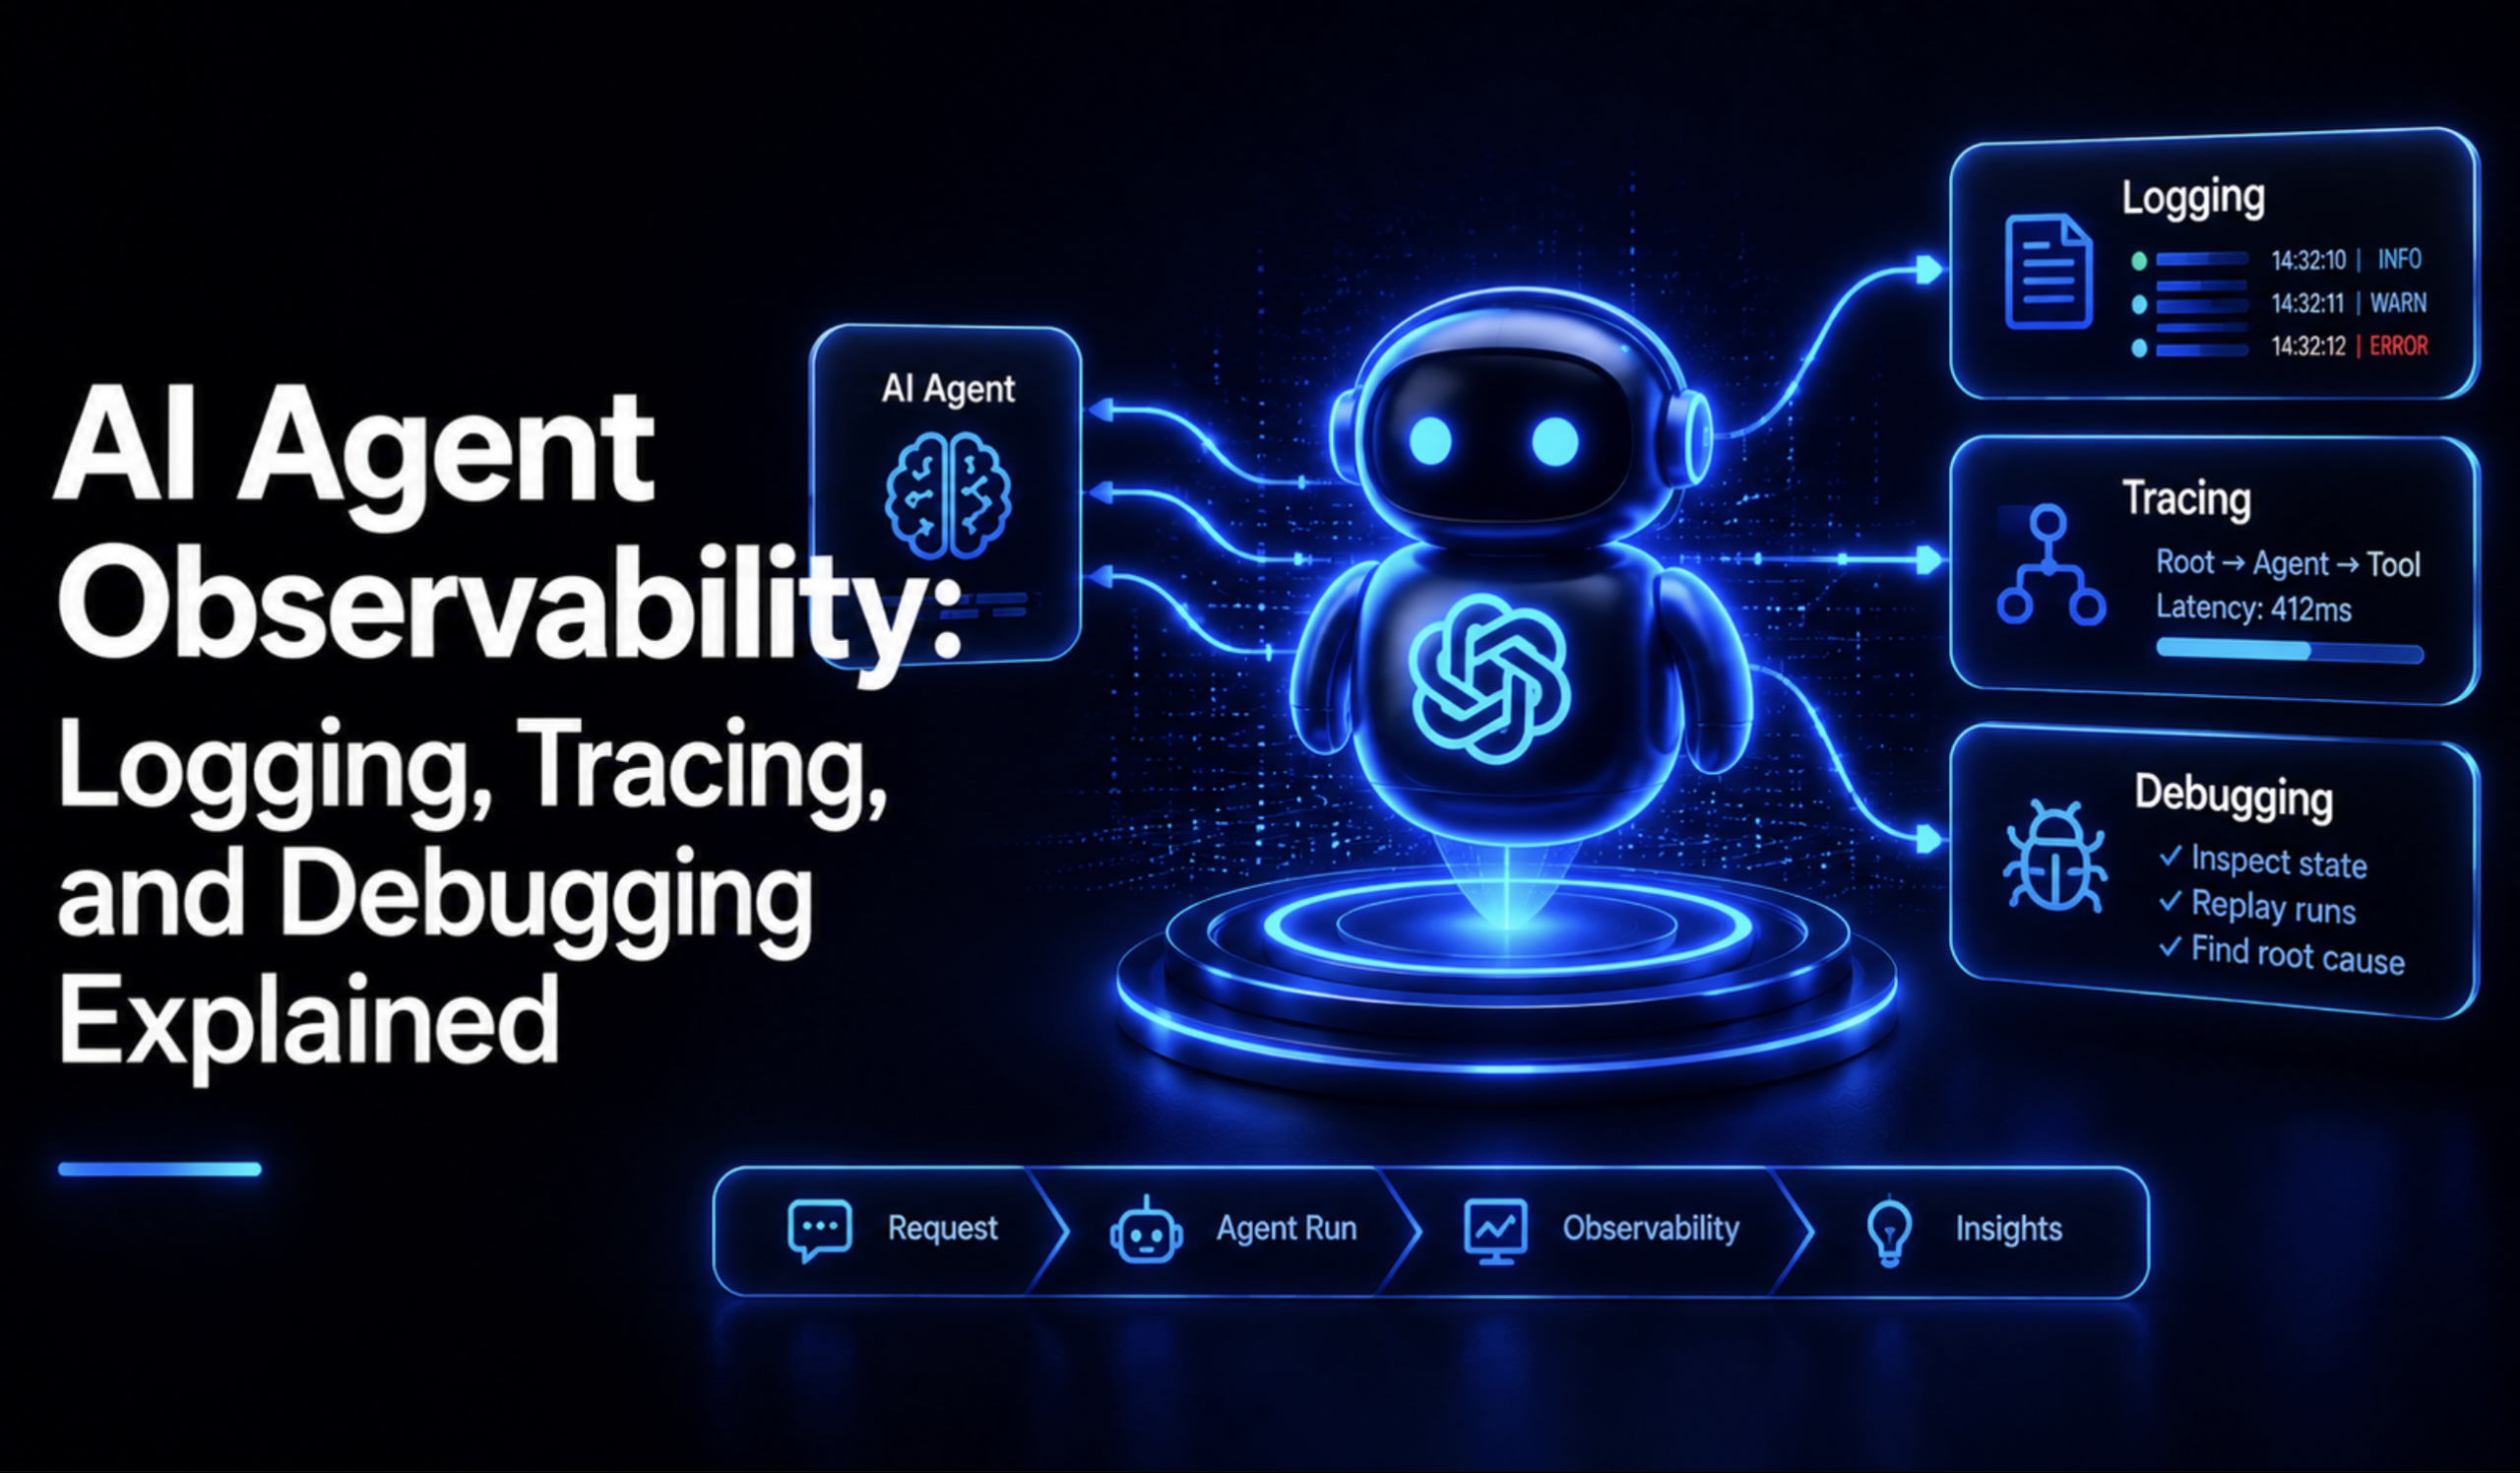
Nesting is the most vital aspect of this process. When an agent calls a tool, that execute_tool span must be a child of the current chat span. This creates a visual "waterfall" in an observability dashboard. If a tool is called twice when it should have been called once, the redundancy is immediately visible as a side-by-side bar in the trace viewer.
3. Token Tracking and Cost Metrics
Metrics are the early warning system. Per recent industry standards, tracking gen_ai.client.token.usage and gen_ai.client.operation.duration as counters and histograms is non-negotiable. It is critical to record input and output tokens separately. A single combined "total tokens" metric hides the fact that a system prompt may have grown bloated, consuming more tokens than the user input itself.
Chronology of an Observability Implementation
For engineering teams looking to implement these systems, the timeline typically follows a three-stage maturation process:
- Phase 1: Basic Instrumentation. Implementation of OpenTelemetry spans around model inference calls and tool executions. This provides immediate visibility into which steps take the longest.
- Phase 2: Semantic Enrichment. Adopting standard attributes for model versions, providers, and usage costs. This allows for cross-model comparisons and precise cost-attribution.
- Phase 3: Automated Debugging. Integrating "time-travel" debugging, where the state of the agent is captured at each step, allowing developers to replay the execution from the point of failure.
Official Industry Standards and Compliance
The recent OpenTelemetry spec version 1.39 has introduced specific support for the Model Context Protocol (MCP). This allows developers to see the protocol mechanics—such as session IDs and method names—directly within their existing traces.
For enterprises, data privacy remains a primary concern. The use of "Telemetry Pipelines"—a middle layer between the application and the backend—allows for the redaction of sensitive prompt and completion data. By deploying a collector, teams can strip sensitive keys like gen_ai.prompt.content before the data leaves their infrastructure, ensuring that observability does not come at the cost of data security.
Implications for Modern Development Teams
The shift toward observability has profound implications for how AI products are built.
- Vendor Neutrality: By adopting OpenTelemetry, teams avoid vendor lock-in. Whether they choose to store data in Langfuse, Arize Phoenix, or Datadog, the instrumentation code remains consistent.
- Proactive Alerting: With robust metrics, teams can set intelligent alerts. For instance, an alert condition triggered when the input-to-output token ratio exceeds 10:1 can prevent "prompt bloat" before it becomes a major performance bottleneck.
- Cost Governance: In 2026, agents are often expensive to run. Observability is no longer just a debugging tool; it is a financial control mechanism. Granular cost tracking ensures that specific features or agents that are not delivering ROI can be optimized or sunset.
The Ecosystem of Choice
The current market for observability platforms is diverse, catering to different operational needs:
- Self-Hosted (Langfuse, Arize Phoenix): Preferred by organizations with strict data residency requirements who want full control over their telemetry backend.
- Managed SDKs (LangSmith, Braintrust): Ideal for teams prioritizing speed of integration and who wish to leverage built-in evaluation tools alongside their traces.
- Proxy Gateways (Helicone): The "zero-code" approach, where traffic is routed through a proxy to log usage. This is highly effective for teams needing immediate visibility with minimal refactoring.
Conclusion
An unmonitored AI agent is a liability. Because agentic failures are designed to mimic success, they bypass the traditional alarms that engineers have relied on for decades. Building a robust observability stack—combining the surgical precision of structured logging, the relational context of distributed tracing, and the bird’s-eye view of metrics—is the only way to manage the inherent unpredictability of LLM-based systems.
As we move deeper into 2026, the question is no longer if an agent will hallucinate or fail, but how quickly the team can pinpoint the error. By treating observability as a first-class citizen of the development lifecycle, teams can build agents that are not only performant and cost-effective but also resilient and transparent. The goal is to reach a point where, when a user reports a "wrong answer," the engineer can open a trace, see the reasoning chain, and understand the "why" in seconds, rather than spending days in a cycle of trial and error.