Monitoring Embedding Drift: Ensuring Reliability for Production LLMs
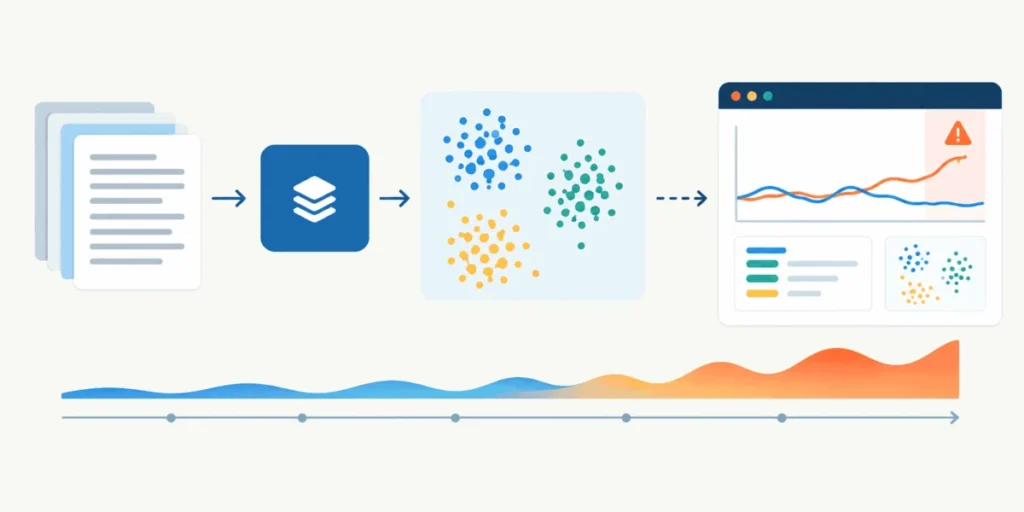
In the rapidly evolving landscape of artificial intelligence, the deployment of a Large Language Model (LLM) is not the finish line—it is merely the starting point. Once a model is integrated into a production environment, it begins to encounter the chaotic, unpredictable nature of real-world data. Unlike static software, machine learning systems are living entities that rely on the quality and relevance of the data they process. As user behavior shifts and the linguistic landscape changes, the "embeddings"—the numerical representations of text that models use to "understand" language—can begin to drift. This phenomenon, known as embedding drift, is a critical challenge for MLOps engineers. If left unmonitored, it can lead to degraded model performance, hallucinations, and a failure to meet user needs.
This article explores the technical reality of embedding drift, why it is a silent killer for production LLMs, and how to implement robust detection pipelines to ensure your systems remain accurate and reliable.
The Nature of Embedding Drift: Why It Matters
Embeddings represent text in high-dimensional vector spaces. A model learns to map semantically similar concepts to nearby points in this space. However, these mappings are learned based on the data distribution present during the training or fine-tuning phase. In production, if the incoming user queries significantly diverge from that initial distribution, the model enters a state of "data drift."
For instance, consider a customer support chatbot trained on queries regarding password resets and billing. If, suddenly, users begin asking about a new cryptocurrency integration or a radical shift in platform policy, the model’s embeddings will fall into a region of the vector space it wasn’t optimized for. This is embedding drift.
Why Traditional Metrics Fail
For years, data scientists relied on statistical tests like the Kolmogorov-Smirnov test or Population Stability Index (PSI) to monitor tabular data. These metrics compare distributions across specific features. However, embeddings are high-dimensional—often 384, 768, or even 1,536 dimensions—and are highly correlated. Standard statistical tests lose their power in these high-dimensional spaces, often failing to detect subtle yet significant shifts in semantic meaning. Therefore, we must turn to more specialized techniques.
Core Techniques for Detecting Embedding Drift
To maintain production integrity, engineers typically utilize two primary categories of drift detection: Model-Based Detection and Geometric/Distance-Based Detection.
1. The Domain Classifier Approach
The domain classifier (or "adversarial validation") technique treats drift detection as a binary classification problem. We train a lightweight model—typically a Random Forest or a Gradient Boosting Machine—to differentiate between "baseline" data (the training set) and "production" data.
- The Logic: If the classifier can distinguish between the two datasets with high accuracy (measured by ROC-AUC), it implies that the datasets are fundamentally different.
- The Threshold: A classifier with an ROC-AUC of 0.5 suggests it is guessing at random, meaning the data distributions are identical. An ROC-AUC approaching 1.0 indicates a massive divergence, necessitating an immediate review of the model or a potential retraining event.
2. Centroid Distance (The "Center of Mass" Method)
The centroid method is computationally more efficient. By calculating the mean vector (centroid) of the baseline data and comparing it to the mean vector of the incoming production data, we can measure the "distance" between the two clusters.
- The Logic: Using cosine distance, we can quantify how far the "average" user query has migrated from the baseline.
- The Trade-off: While extremely fast, this method ignores the complexity of the data’s shape. It is highly effective at detecting global shifts in topic but may miss "multi-modal" drift, where users begin asking about two completely different subjects simultaneously.
Implementation: A Practical Framework
To illustrate these concepts, let us build a simulation. We will generate two synthetic sets of 384-dimensional embeddings, representing our baseline and our "drifted" production environment.
Simulating the Data
Using numpy, we create a baseline dataset centered at 0.0. To simulate drift, we create a production dataset with a mean shift to 0.3.
import numpy as np
from sklearn.ensemble import RandomForestClassifier
from sklearn.model_selection import train_test_split
from sklearn.metrics import roc_auc_score

n_samples = 500
n_features = 384

# Baseline and Production data generation
np.random.seed(42)
X_reference = np.random.normal(loc=0.0, scale=1.0, size=(n_samples, n_features))
X_production = np.random.normal(loc=0.3, scale=1.0, size=(n_samples, n_features))
Building the Domain Classifier
By combining these datasets and assigning labels (0 for baseline, 1 for production), we can train our classifier to act as a drift sentinel.
# Labeling and combining
y_reference = np.zeros(n_samples)
y_production = np.ones(n_samples)
X_combined = np.vstack((X_reference, X_production))
y_combined = np.hstack((y_reference, y_production))

# Train-test split
X_train, X_test, y_train, y_test = train_test_split(X_combined, y_combined, test_size=0.3)

# Classifier
drift_clf = RandomForestClassifier(n_estimators=50, max_depth=5).fit(X_train, y_train)
roc_auc = roc_auc_score(y_test, drift_clf.predict_proba(X_test)[:, 1])

if roc_auc > 0.65:
    print(f"ALERT: Drift detected (AUC: roc_auc:.2f)")
Real-World Application: Scikit-LLM and Vectorization
When moving from simulated data to real-world text, we rely on libraries like SentenceTransformer and Scikit-LLM. In this scenario, we process actual user queries—for example, shifting from standard IT support questions to high-frequency cryptocurrency trading questions.
The Impact of Topic Shift
When we encode these distinct topics, the resulting embedding vectors occupy entirely different neighborhoods. A classifier will achieve an ROC-AUC of 1.0, essentially saying, "I have never seen these concepts before." This provides a definitive signal that the model’s internal knowledge base is outdated.
Why Centroids Still Matter
Even with advanced transformers, the centroid method remains a vital "sanity check." While it may lose the nuance of specific clusters, it provides a high-level heartbeat monitor. If the cosine distance between the daily centroid and the monthly baseline exceeds a predefined threshold, it triggers an alert for a human-in-the-loop audit.
Implications for Production Architecture
Monitoring for drift is not just about logging errors; it is about creating a feedback loop. When drift is detected, organizations must decide on a policy:
- Passive Alerting: A dashboard flag alerts the MLOps team that performance may be degrading.
- Automated Retraining: If drift is extreme, the system triggers a pipeline to gather new data, label it, and fine-tune the model.
- Dynamic Prompt Engineering: Sometimes, drift isn’t a failure of the model but a change in intent. Instead of retraining, the system might update its System Prompt to handle the new category of user queries more effectively.
The Future of Monitoring
As we look forward, we expect to see more "drift-aware" architectures. These systems will not just detect when data has changed, but will automatically adjust their retrieval-augmented generation (RAG) contexts to include new information that aligns with the shifted user distribution.
Conclusion
Embedding drift is an inevitable byproduct of successful AI deployment. As user bases grow and the world changes, so too must our models. By implementing robust, automated detection systems—ranging from lightweight centroid checks to sophisticated domain classifiers—we can ensure that our LLMs do not merely exist in production, but thrive there. The goal is to move away from "set it and forget it" AI and toward a model of continuous, vigilant monitoring that keeps pace with the speed of human communication.