The Silent Failure: Mastering AI Agent Observability in 2026
In the modern enterprise, the rise of AI agents has introduced a new paradigm of software development. Unlike traditional deterministic systems—where a failure triggers an HTTP 500 error or a logged exception—AI agents often "fail" by providing high-confidence, perfectly formatted, yet factually disastrous answers.
Consider a scenario: a customer support agent processes a ticket. It calls a refund-lookup tool, receives data, ignores it, calls the tool again with slightly modified arguments, and then synthesizes a response based on the second result. The system reports a "200 OK" status. The latency is within bounds. No crashes occur. The failure only comes to light two days later when a customer complains. By then, the state of the system is long gone, and the "black box" nature of the agent makes reconstruction impossible.
This article explores the critical discipline of AI Agent Observability: the practice of capturing, tracing, and analyzing agentic behavior to ensure reliability in an era where software is no longer strictly deterministic.
The Shift: Why Traditional Monitoring Fails Agents
Traditional monitoring tools were built for a world of predictable inputs and outputs. They track metrics like CPU usage, I/O wait times, and request counts. However, agentic systems break these fundamental assumptions.
The Unpredictability of Non-Deterministic Paths
In an agentic workflow, the same input does not guarantee the same execution path. Factors such as temperature settings, retrieval results, and the availability of dynamic tools create a branching logic that changes with every run. A single "it works on my machine" test case is insufficient because the distribution of possible paths is infinite.
Cost and Latency Redefined
In traditional apps, cost correlates with request volume. In AI agents, cost and latency correlate with token consumption. A single request might trigger multiple model calls, recursive tool executions, and extensive context window processing. A monitoring setup blind to token usage will inevitably suffer from "budget drift," where costs spiral without a corresponding increase in user traffic.
The Privacy Paradox
Finally, prompts themselves often contain sensitive personal or confidential information. Naive logging—dumping raw prompt text into a backend—creates a compliance nightmare. Modern observability must balance the need for deep debugging with strict data privacy, utilizing techniques like PII masking and structured metadata logging.
| Signal | Traditional App | LLM / AI Agent |
|---|---|---|
| Latency Driver | CPU, I/O, Network | Token Count, Context Window |
| Cost Unit | Requests per second | Tokens consumed |
| Failure Mode | Exception, Timeout | Hallucination, Tool Error |
| Debug Artifact | Stack Trace | Reasoning Chain, Prompt/Completion |
Structured Logging: The Foundation of Visibility
Logging remains the primary foundation of observability, but for agents, it must be highly structured. A log entry that simply states "tool call failed" is useless in a concurrent environment.
The key is contextual linkage. By attaching a trace_id—a standard feature of OpenTelemetry—to every log line, engineers can aggregate all events associated with a specific user interaction. Instead of free-text sentences, logs should capture structured metadata: which tool was invoked, the arguments passed, the duration of the hop, and the token consumption metrics.
By logging only the length of tool outputs or truncated previews rather than the full payload, teams can avoid privacy liabilities while still maintaining enough detail to diagnose issues.
Tracing: Stitching the Reasoning Chain
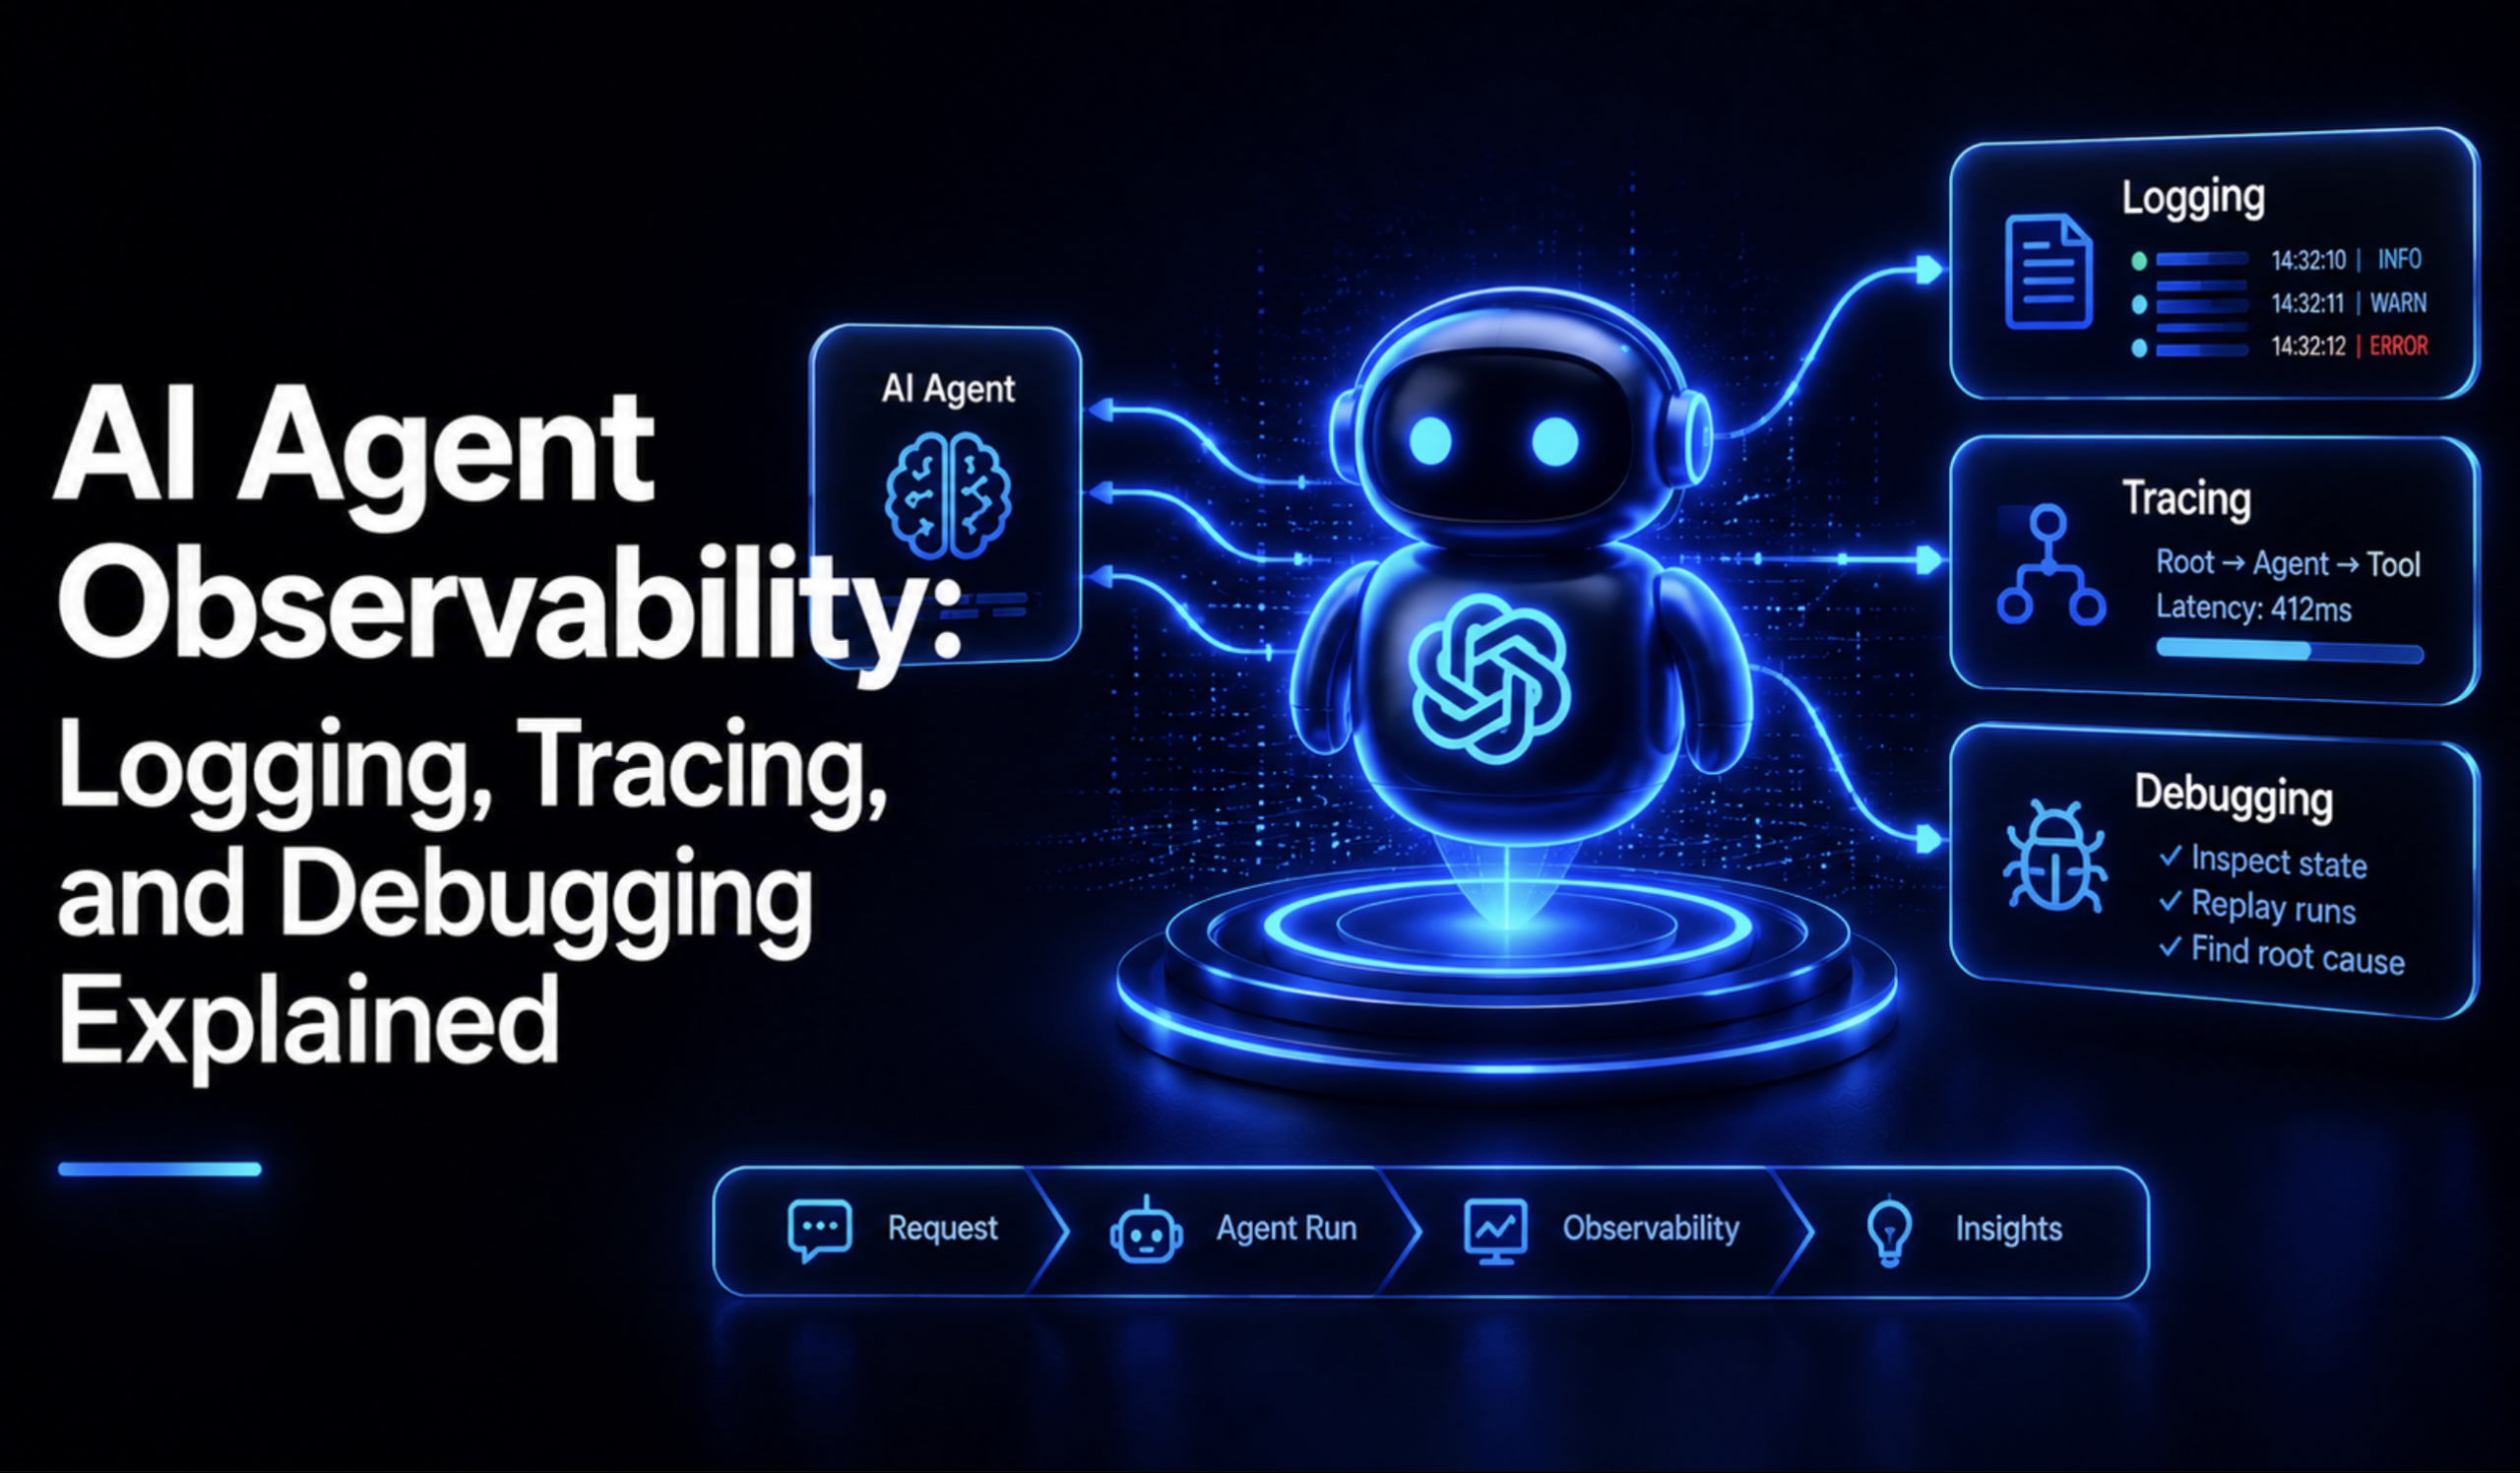
If logs provide the "what," tracing provides the "why." Tracing stitches individual events into a logical "waterfall" view, illustrating the parent-child relationship between model inferences and tool executions.
Adopting OpenTelemetry GenAI Conventions
The industry has converged on the OpenTelemetry GenAI semantic conventions. These standards define operation types such as create_agent, invoke_agent, and execute_tool. By using these standardized attributes, teams ensure that traces remain consistent, regardless of the underlying framework (e.g., LangChain, CrewAI, or custom implementations).
Reading the Waterfall
A trace waterfall is a visual representation of an agent’s reasoning chain. An engineer looking at a waterfall can immediately spot inefficiencies:
- Redundant Tool Calls: Seeing the same tool invoked twice in rapid succession.
- Runaway Reasoning: A model spending 30 seconds on a task that should take 500ms.
- Tooling Failures: A
chatspan that terminates abruptly because anexecute_toolspan recorded an exception.
Metrics and Alerting: Tracking Trends
While traces explain individual runs, metrics track aggregate health. Per Uptrace’s recommendations for AI systems, two metrics are load-bearing: gen_ai.client.token.usage (a counter) and gen_ai.client.operation.duration (a histogram).
Critical Alerting Conditions
Effective observability requires proactive alerting. Teams should monitor:
- Token Usage Rate: If usage spikes to double the baseline over 10 minutes, it may indicate a recursive loop or a prompt injection attempt.
- p99 Duration: If the 99th percentile of model calls exceeds 30 seconds, it likely signals that the context window is bloated or the model is overloaded.
- Input-to-Output Ratio: A ratio consistently exceeding 10:1 suggests the system prompt has become overly verbose, leading to wasted tokens and potential performance degradation.
Telemetry Pipelines and Security
As data moves from the application to the backend, it must pass through a telemetry pipeline—typically managed by an OpenTelemetry Collector. This middle layer is the perfect place to sanitize data. By using transformation processors, teams can automatically delete keys containing PII (like gen_ai.prompt.content) before they ever reach the observability backend.
Furthermore, the introduction of the Model Context Protocol (MCP) in 2026 has added a new layer to this pipeline. Newer instrumentation enriches existing execute_tool spans with metadata like mcp.session.id, allowing developers to trace agentic actions back to the specific protocol version and session, providing clarity in multi-agent environments.
Debugging Workflows in 2026
With robust tracing in place, the debugging process evolves from "guessing and re-running" to "surgical analysis."
Replay and Time-Travel Debugging
Platforms like AgentOps have popularized "time-travel debugging," where an engineer can restore the exact state of an agent at a specific step in its reasoning chain. This allows for precise reproduction of failures without needing to recreate the entire environmental context from scratch.
Natural Language Querying
The bleeding edge of 2026 observability involves AI-assisted analysis. Tools like LangSmith allow engineers to ask, "Why did the agent enter this loop?" and receive an answer derived from the trace metadata. This reduces the cognitive load on developers, enabling them to focus on fixing systemic logic flaws rather than spending hours parsing JSON traces.
The Vendor Landscape: Selecting Your Stack
When selecting an observability platform, the decision rests on the deployment model:
- Self-Hosted (Langfuse, Arize Phoenix): Best for teams with strict data residency requirements who want full control over their infrastructure.
- Managed SDKs (LangSmith, Braintrust): Ideal for teams prioritizing speed, providing out-of-the-box evaluation and tracing without the burden of maintaining a backend.
- Proxy Gateways (Helicone): The simplest path to observability; they sit in front of the LLM provider and log traffic with zero code changes, though they introduce a potential single point of failure.
Implications for Future Development
The transition to agentic systems is not just a technological shift; it is a cultural one. Developers must move away from the "fire and forget" mentality of traditional web services. In 2026, the quality of an agent is defined not just by its capabilities, but by its observability.
If you cannot measure the reasoning chain, you cannot improve it. By implementing structured logging, detailed tracing, and automated metrics, organizations can mitigate the risks of AI hallucinations and ensure that their agents remain reliable, cost-effective, and secure. The tools exist—now, it is a matter of building them into the foundation of every agentic deployment.